Using Grafana to visualize Continuous Delivery Indicators in the open source Jenkins X cloud native CI/CD project

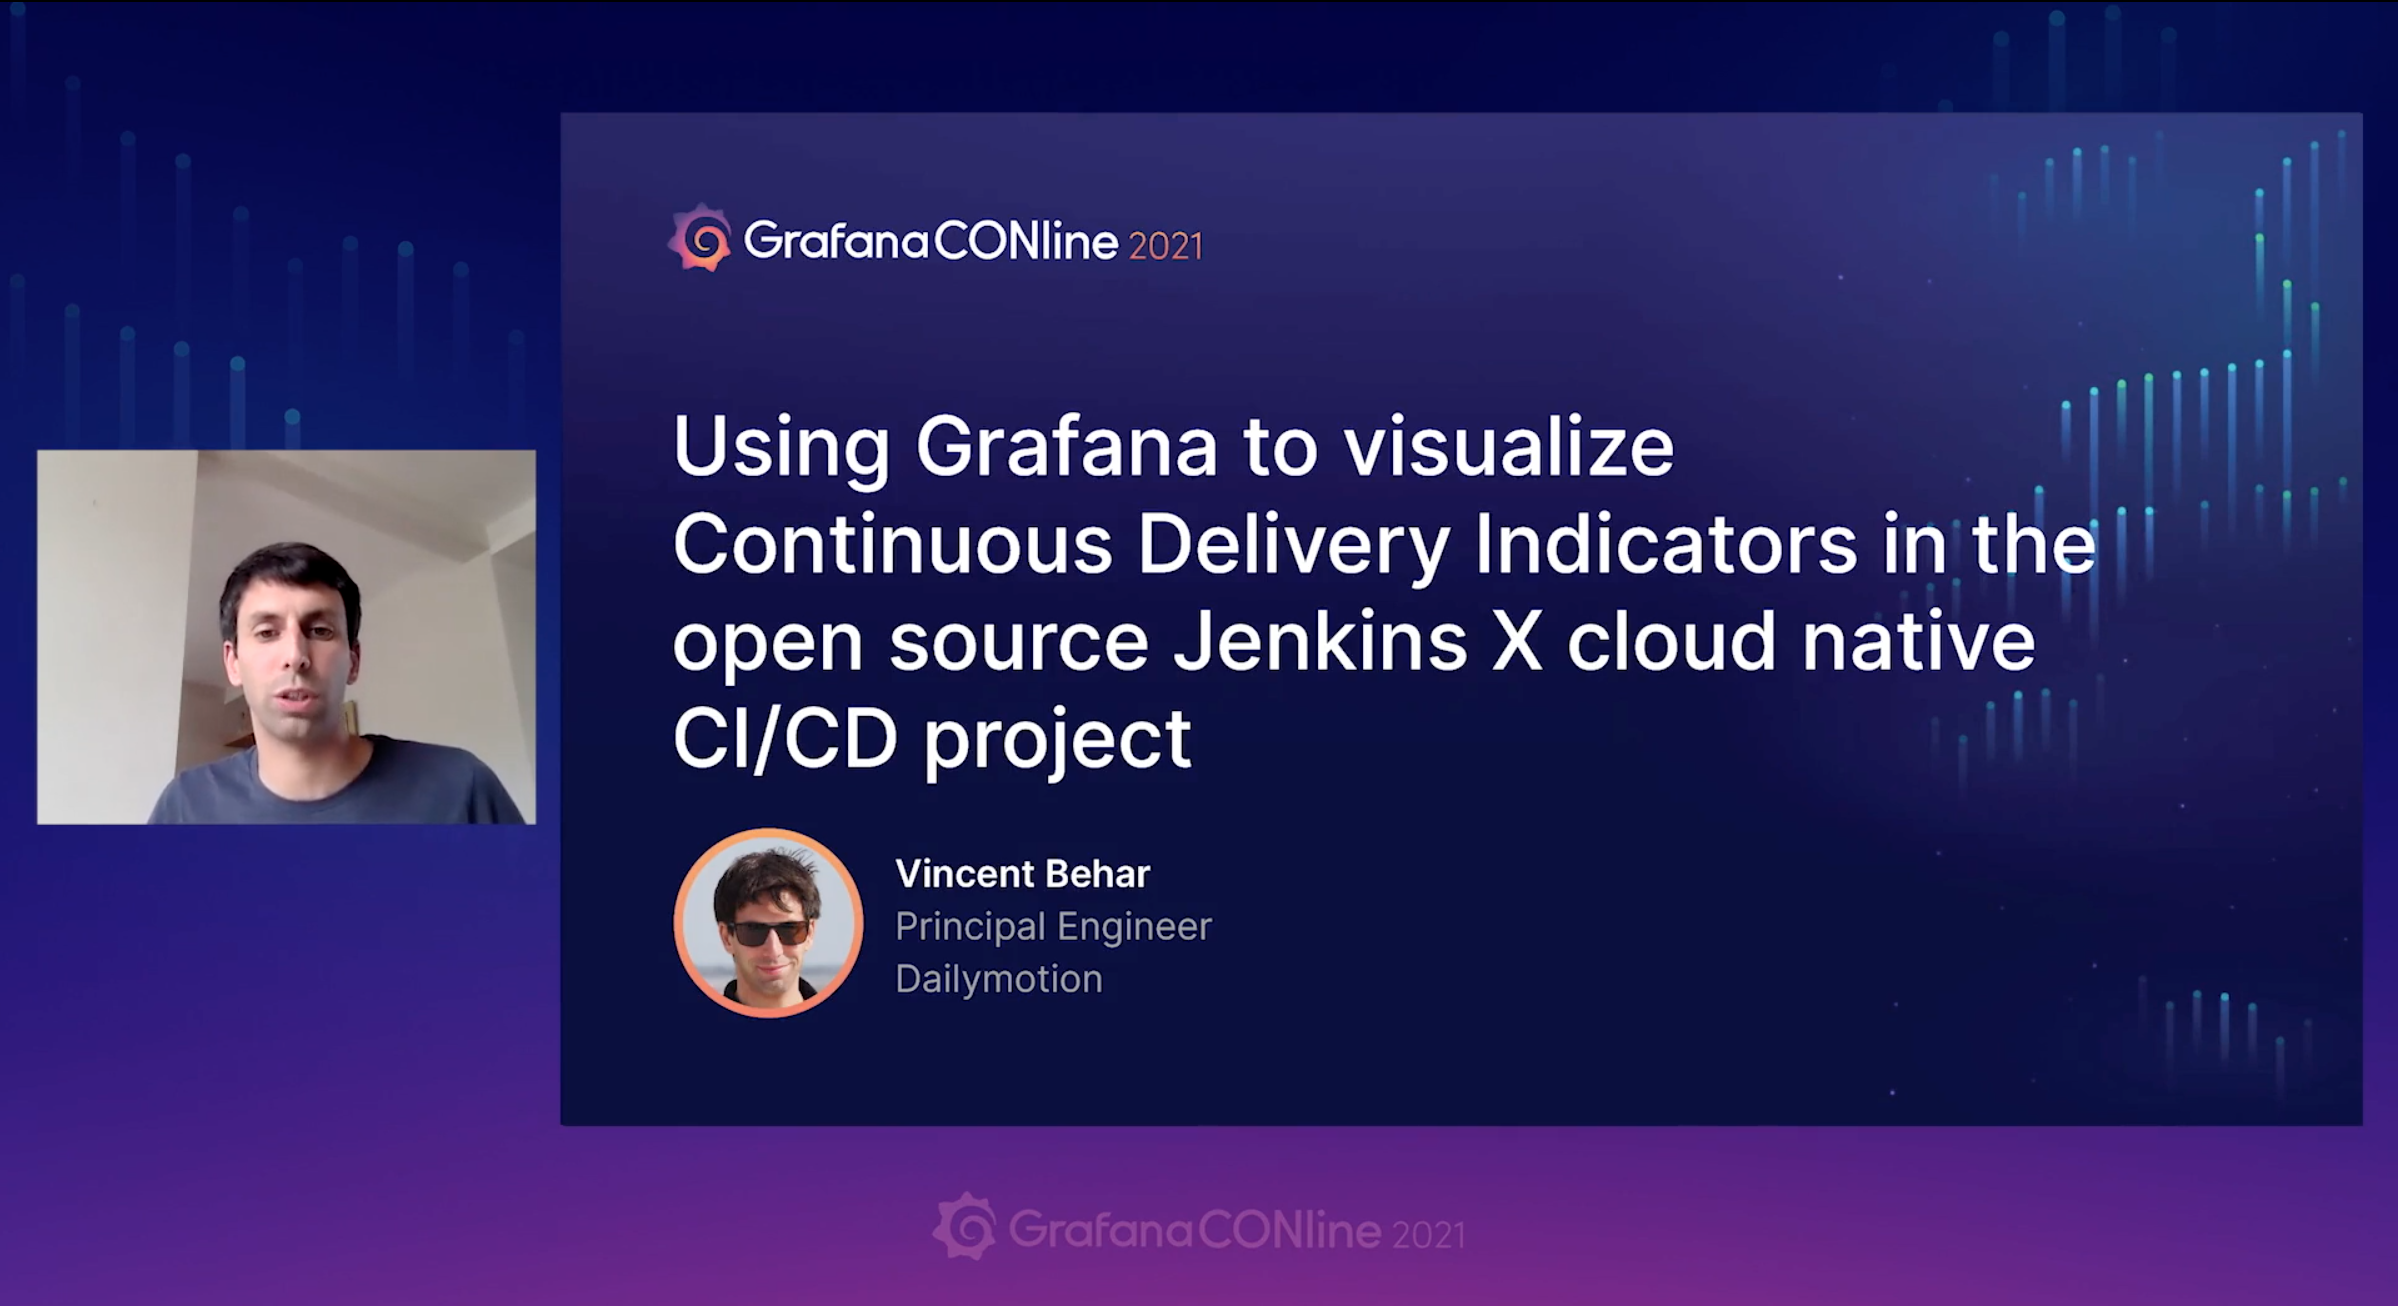
At the GrafanaCONline 2021 Conference, I gave a talk titled Using Grafana to visualize Continuous Delivery Indicators in the open source Jenkins X cloud native CI/CD project - yes, I’m competing for the longest conference talk title!
In this talk, I shared how we are using Grafana in Jenkins X for everything observability-related, and more specifically to visualize Continuous Delivery Indicators:
- why Grafana
- how Grafana is setup in a Kubernetes cluster
- how the CD indicators application is exposing its dashboards and datasource for Grafana to consume
You can watch the talk on the Grafana website.
😎 Starting shortly at #GrafanaCONline: @vbehar will walk you through how @jenkinsxio is using the Grafana Stack to visualize Continuous Delivery Indicators.
— Grafana (@grafana) June 17, 2021
📺 Watch here and submit your questions live: https://t.co/DHElhS9Ozp pic.twitter.com/z9q3ZsTyr1
Get to know #GarfanaCONline 2021 speaker @vbehar from @Dailymotion. Catch Vincent's session on June 17 to find out how @jenkinsxio is using Grafana, Prometheus, and Loki for platform observability. https://t.co/cDS7ajiheo pic.twitter.com/olG4uY9kPR
— Grafana (@grafana) June 17, 2021