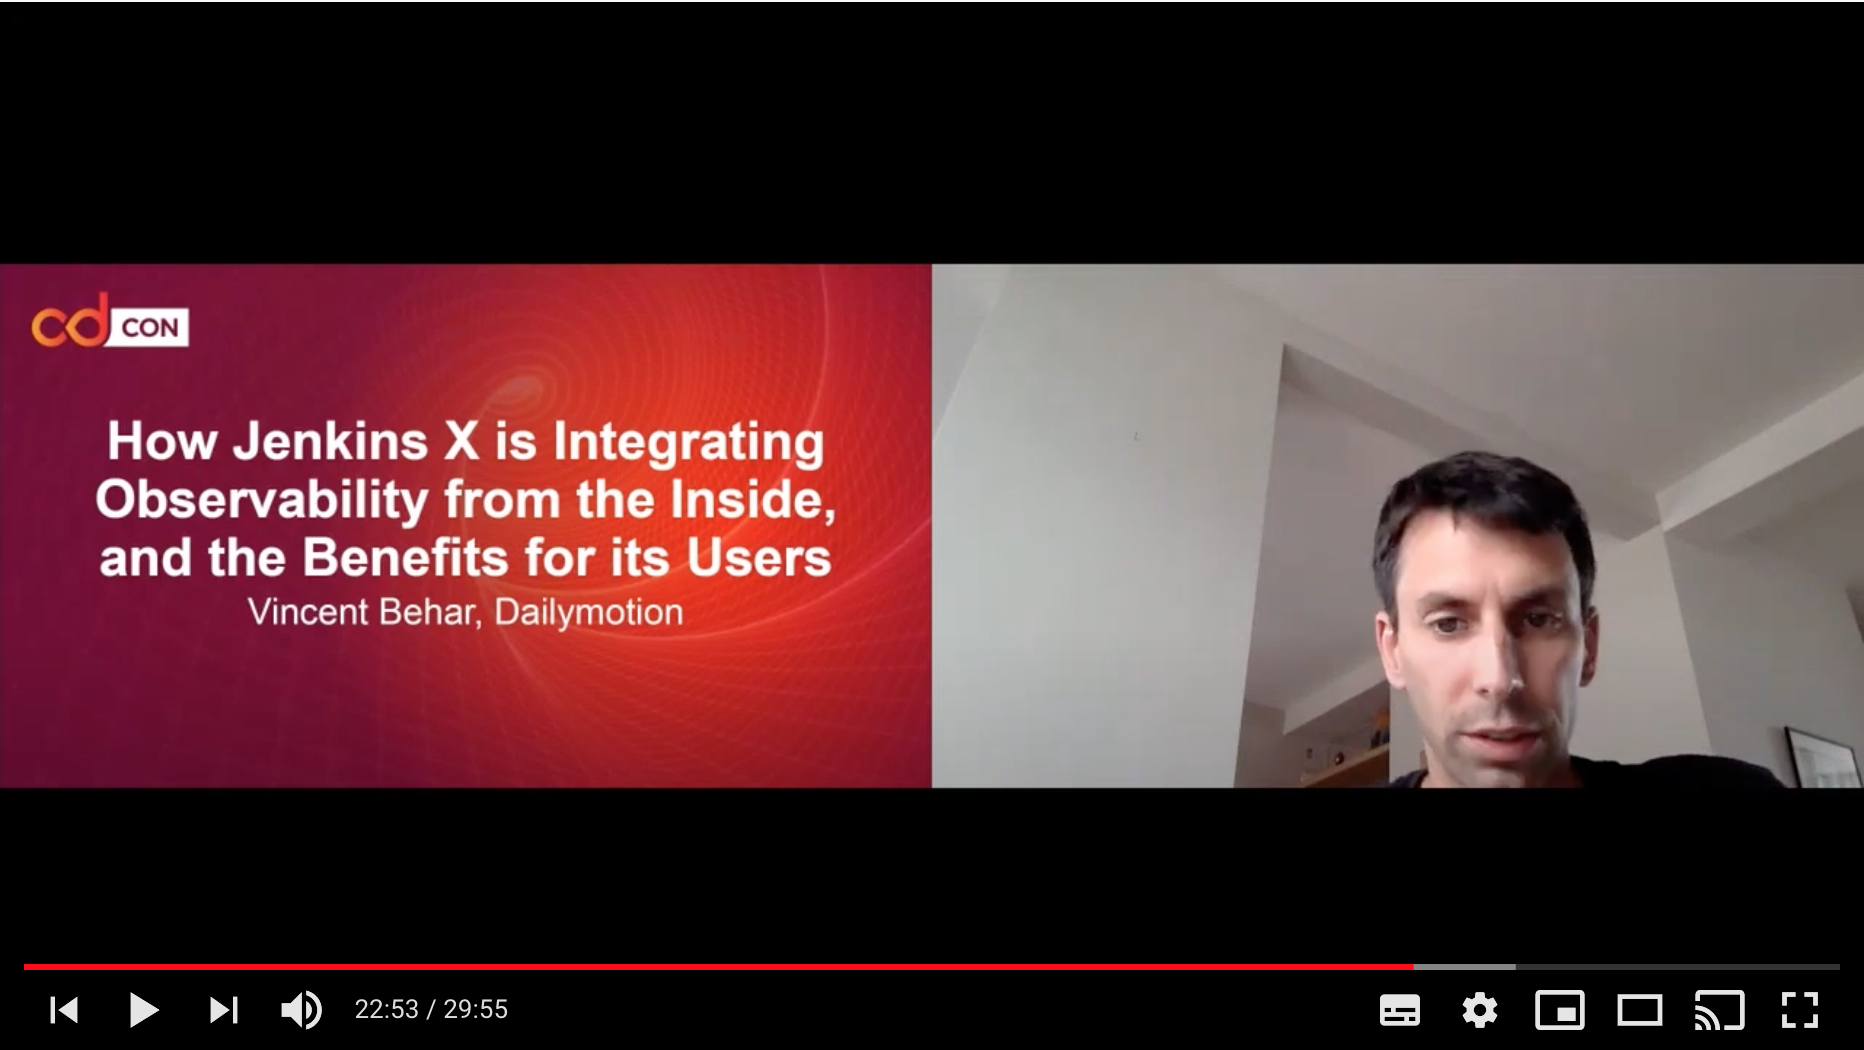
How Jenkins X is Integrating Observability from the Inside, and the Benefits for its Users

At the cdCon conference, in june 2021, I gave a talk titled How Jenkins X is Integrating Observability from the Inside, and the Benefits for its Users.
In this talk, I explained what observability means for a Continuous Delivery platform such as Jenkins X, and why it’s important.
I went through how Jenkins X v3 is integrating observability from the inside, using standards such as OpenTelemetry, and packaging a full observability stack using Grafana - with Loki, Promtail, Tempo, and Prometheus.
I highlighted the benefits for the users:
- platform observability with alerting for all the Kubernetes components (Lighthouse, Tekton, Cert-Manager, …)
- out-of-the-box dashboards for Continuous Delivery Indicators (Mean Lead Time, Time To Review, Release, and Deployment Frequency, …)
- distributed traces for your pipelines
How @jenkinsxio is Integrating Observability from the Inside, and the user benefits w/@vbehar, @dailymotion #cdConhttps://t.co/Fl7FgbPCbs pic.twitter.com/9ogT1MVtzN
— Continuous Delivery Foundation (CDF) (@CDeliveryFdn) May 11, 2021