Jenkins X Observability with Grafana Demo
Link to full Office Hours Demo
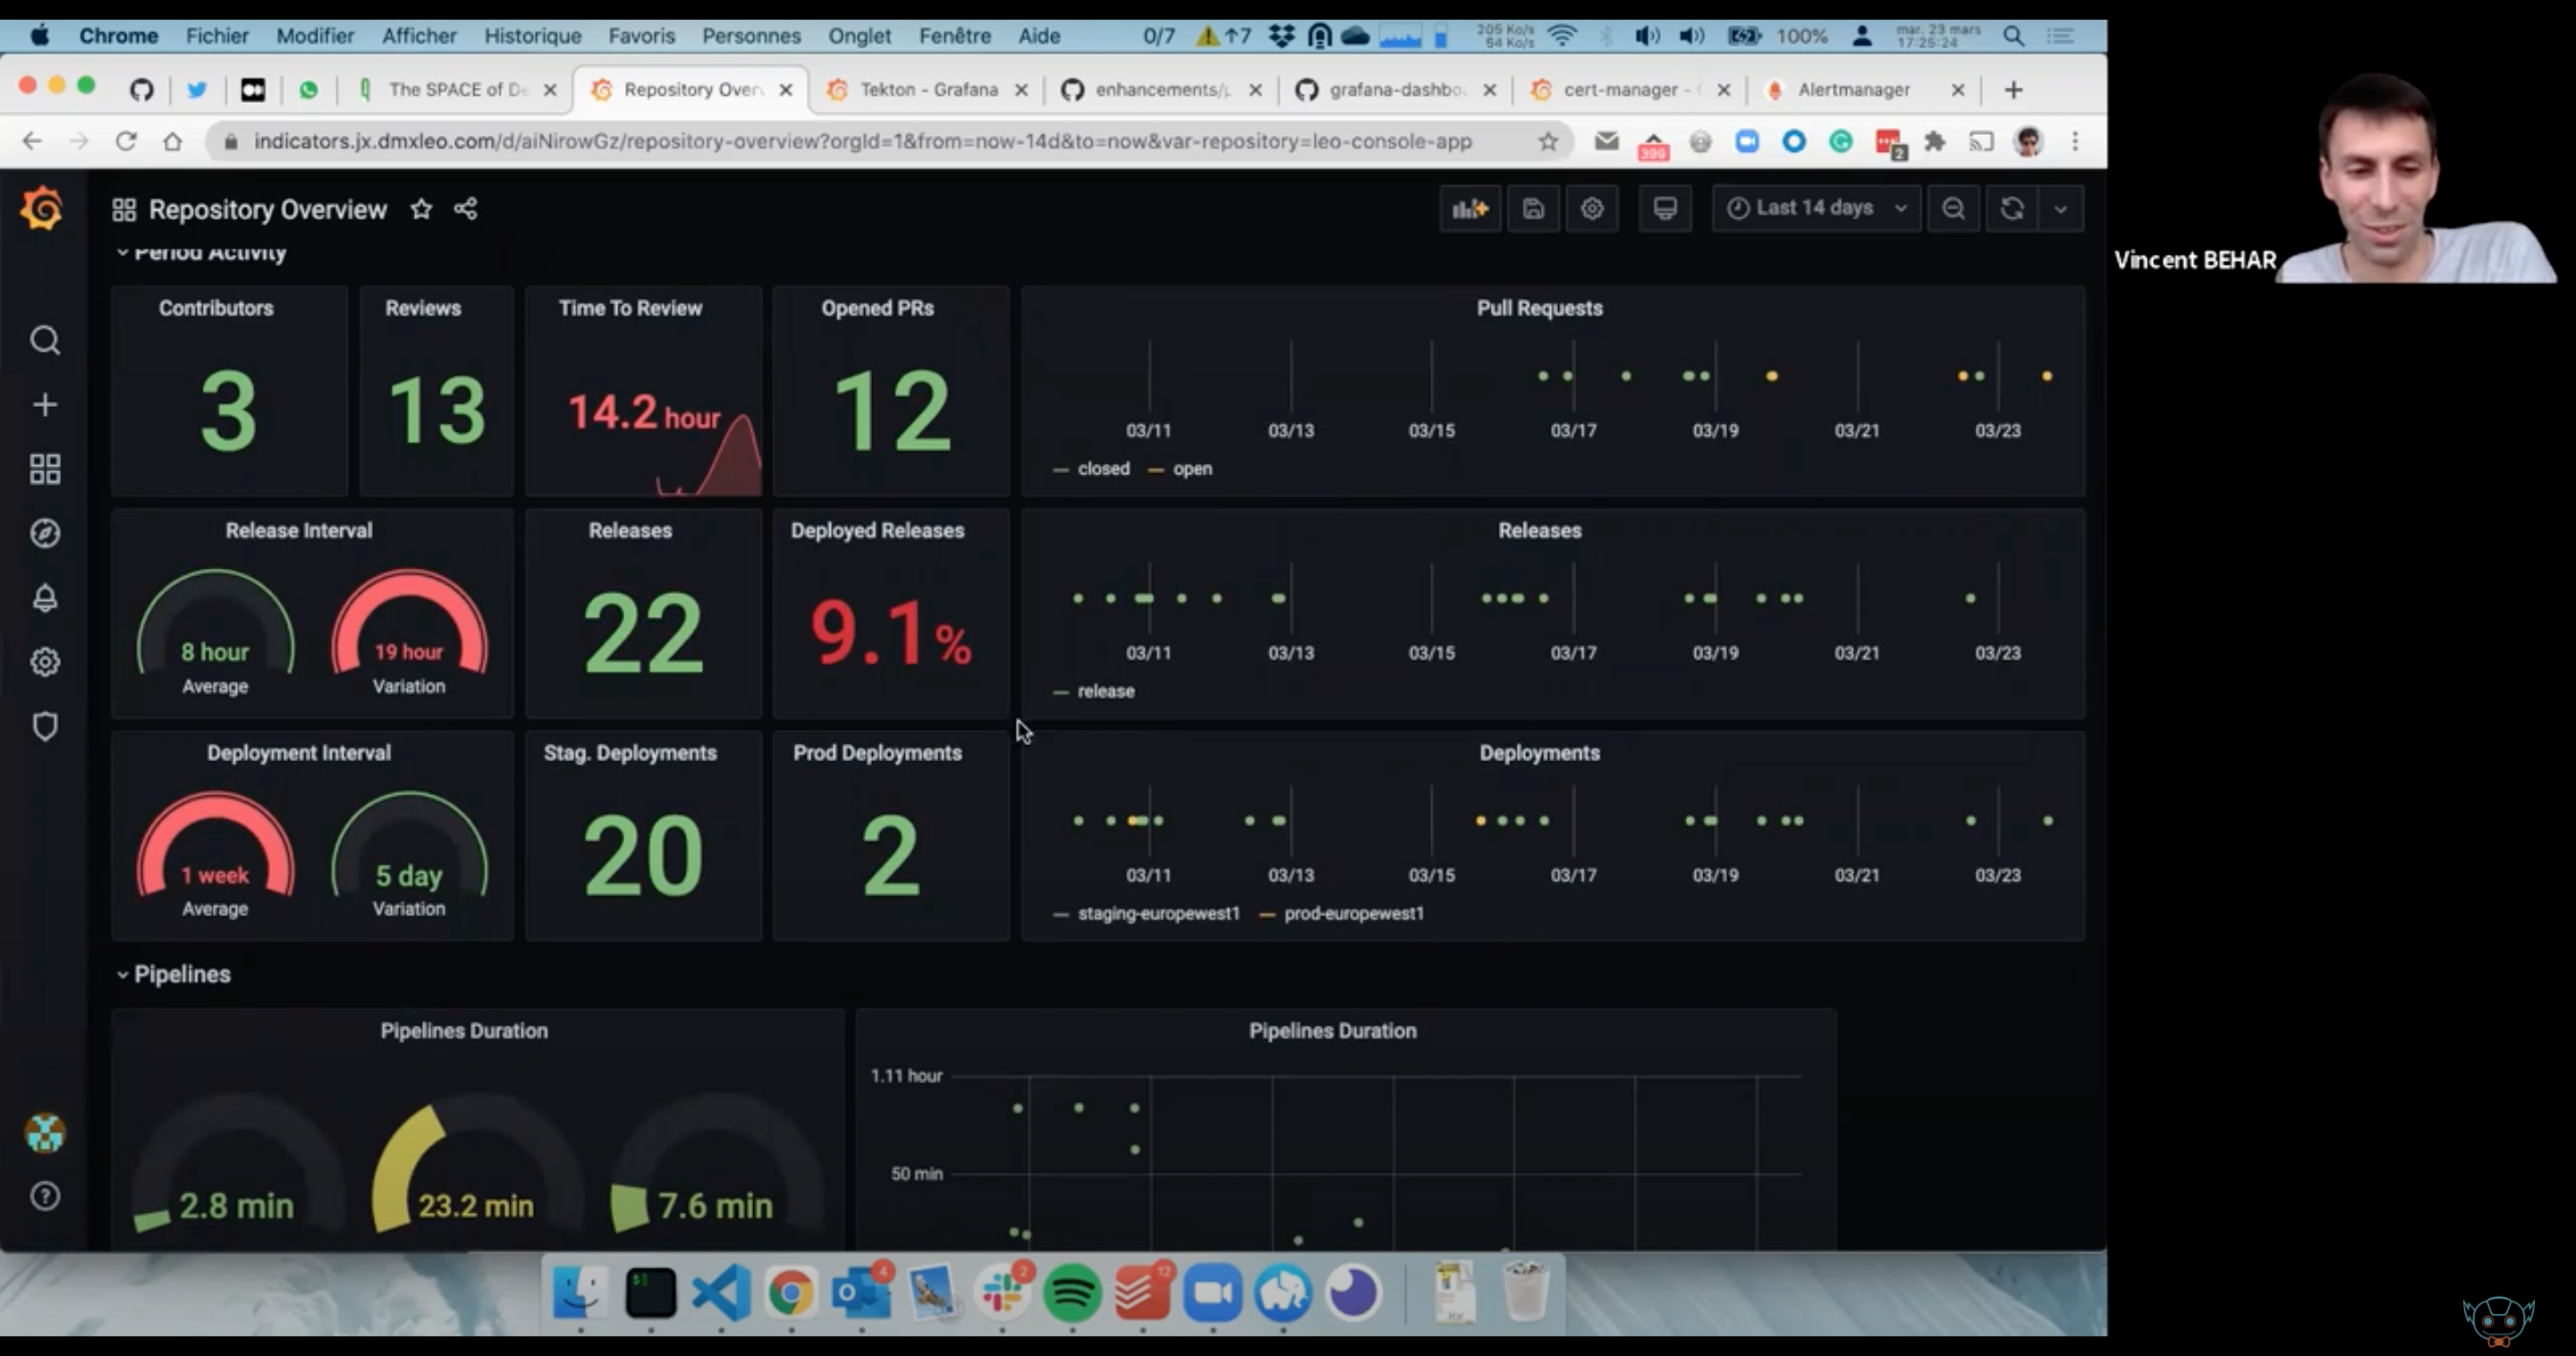
At the Jenkins X Office Hours, in march 2021, I did another demo of using the Grafana stack (loki/promtail, tempo, prometheus and grafana) for platform-level and Continuous Delivery Indicators observability in a Jenkins X platform (tekton, lighthouse, …)
Tomorrow at the @jenkinsxio Office Hours I'll do another demo and status update on the @grafana integration. Observability is coming to Jenkins X!
— Vincent Behar (@vbehar) March 22, 2021