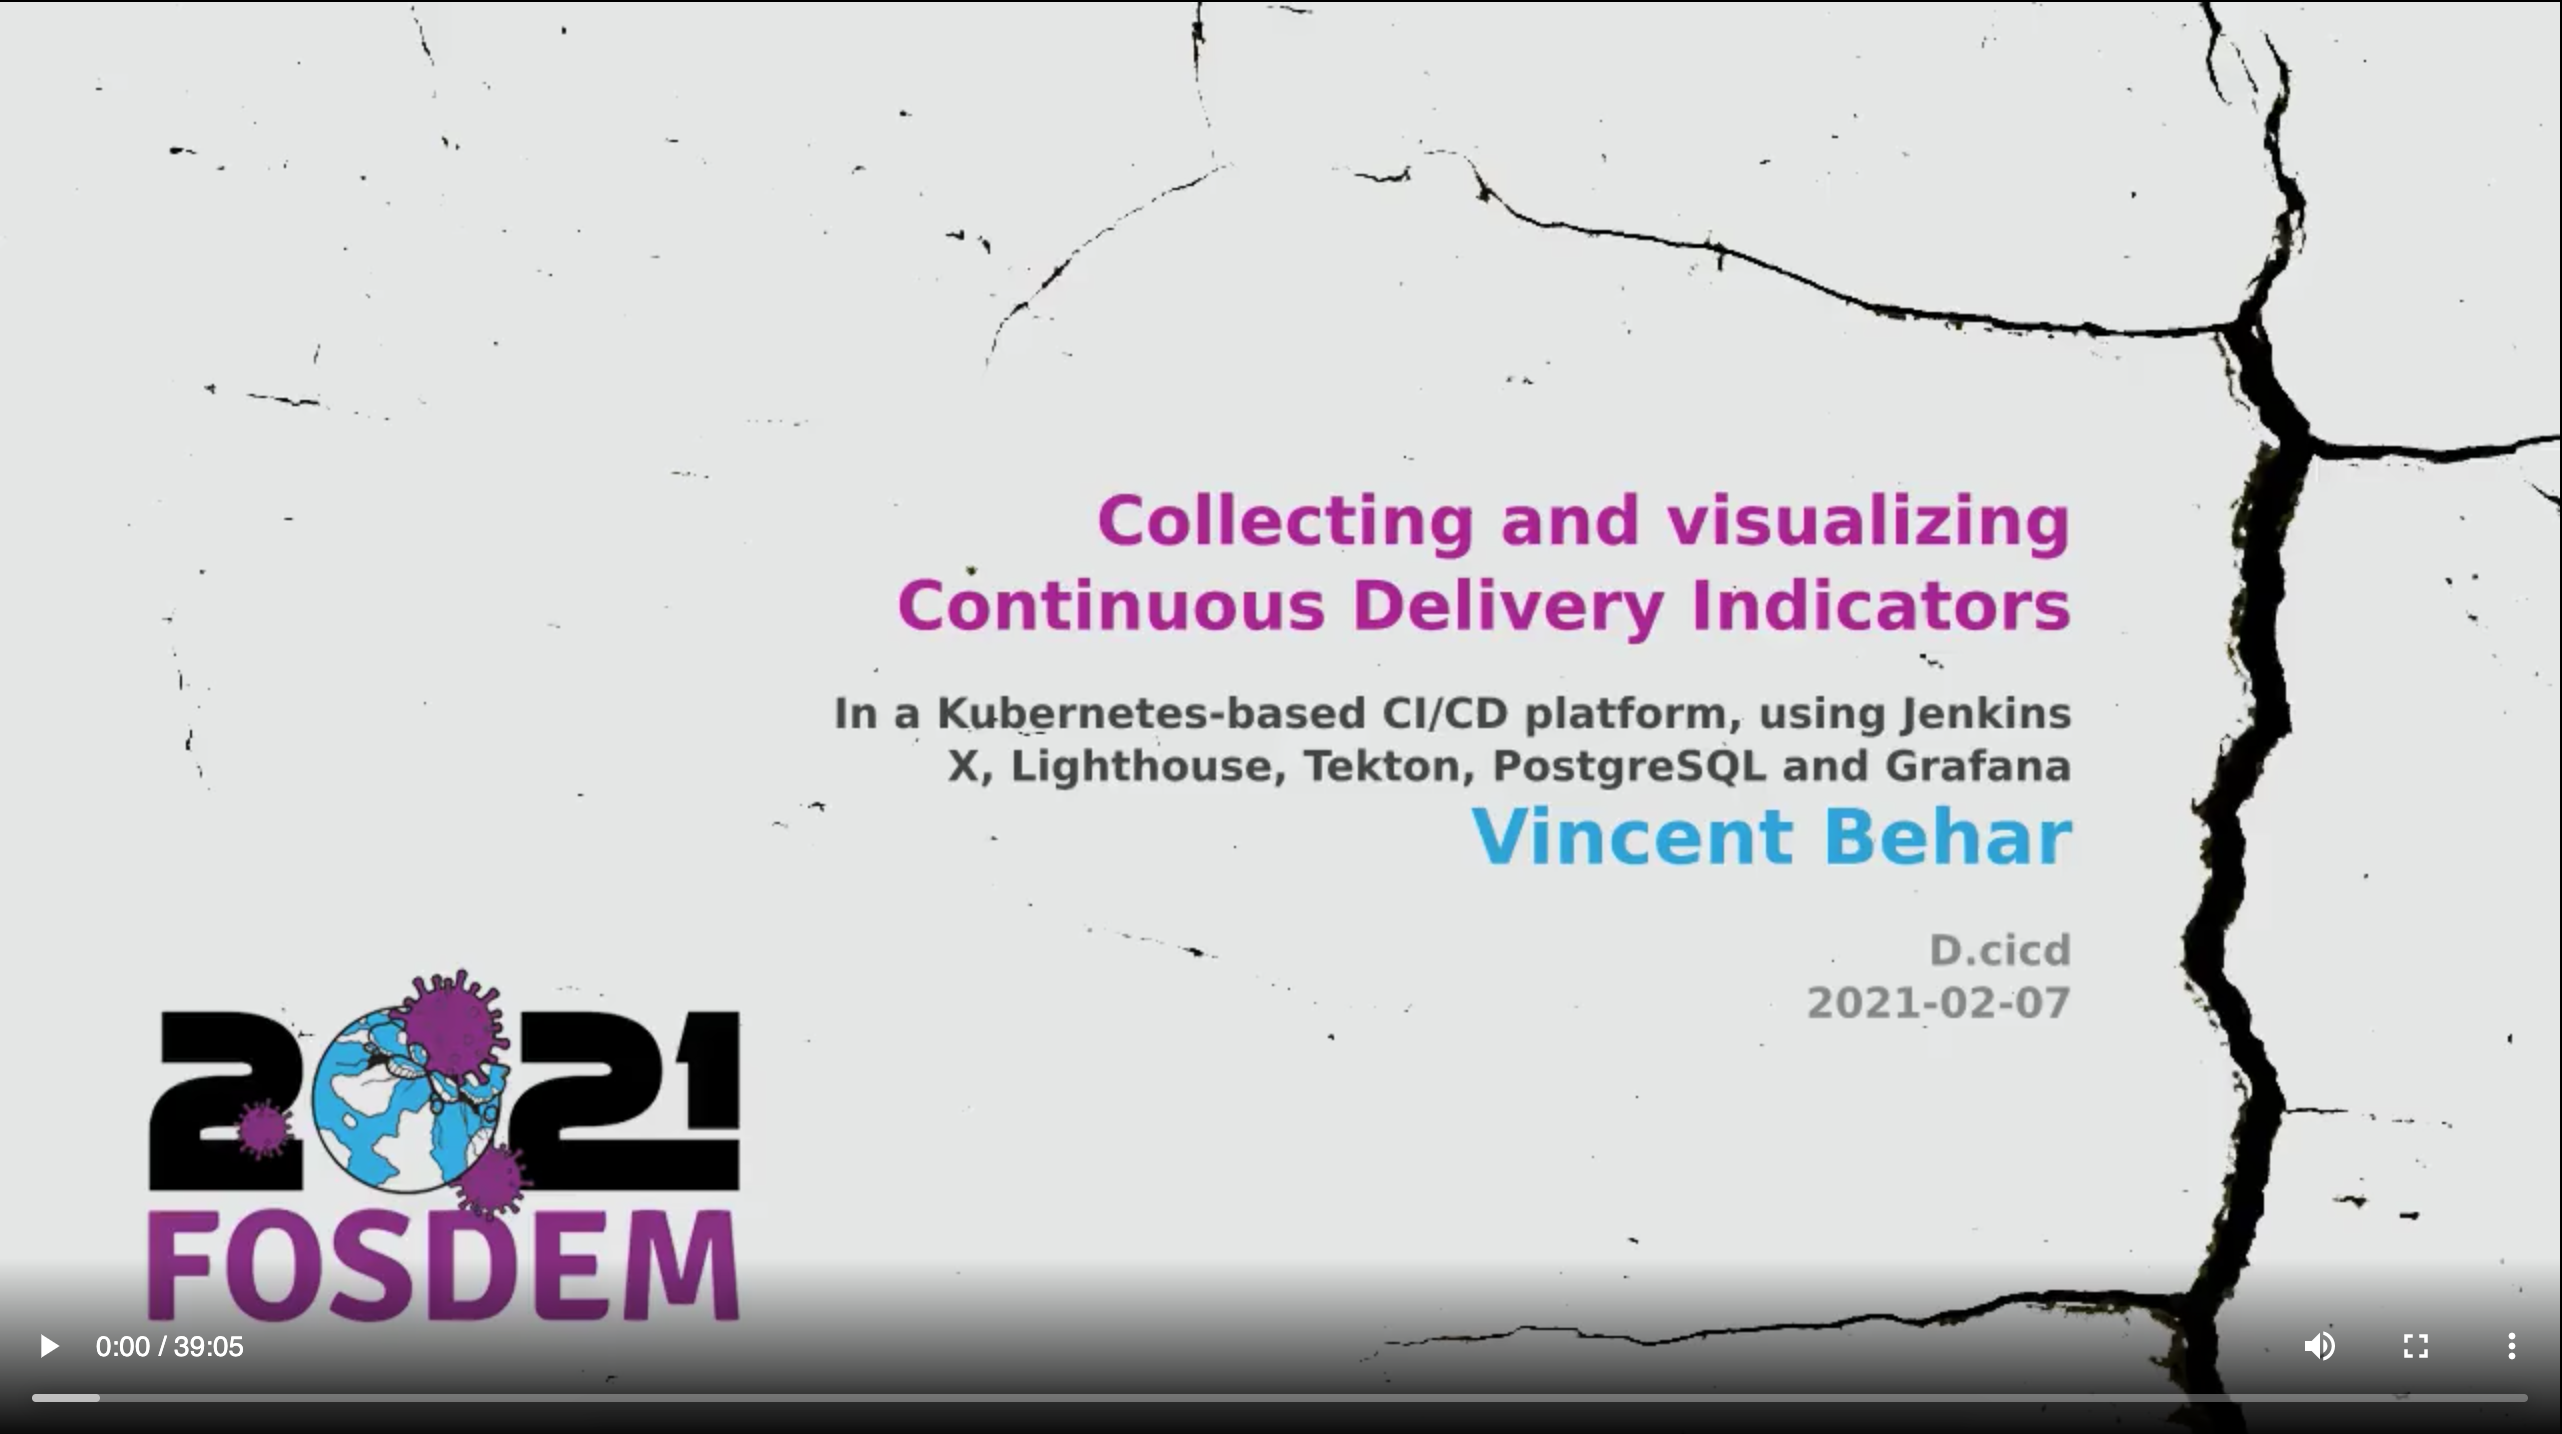
Collecting and visualizing Continuous Delivery Indicators

At the Fosdem 2021 Conference, I gave a talk titled Collecting and visualizing Continuous Delivery Indicators in a Kubernetes-based CI/CD platform, using Jenkins X, Lighthouse, Tekton, PostgreSQL and Grafana in the CI/CD devroom.
In this talk, I shared our experience at Dailymotion on:
- defining CD Indicators
- collecting them from a Kubernetes-based CI/CD platform
- storing them in PostgreSQL
- visualizing them using Grafana
You can watch the talk on video.fosdem.org or directly here:
Feb. 7 at 13:45 CET @FOSDEM
— Continuous Delivery Foundation (CDF) (@CDeliveryFdn) February 4, 2021
Collecting and visualizing Continuous Delivery Indicators in a Kubernetes-based CI/CD platform, using @jenkinsxio, Lighthouse, @tektoncd, PostgreSQL and Grafana w/ speaker @vbehar https://t.co/CtvUdUqJYY